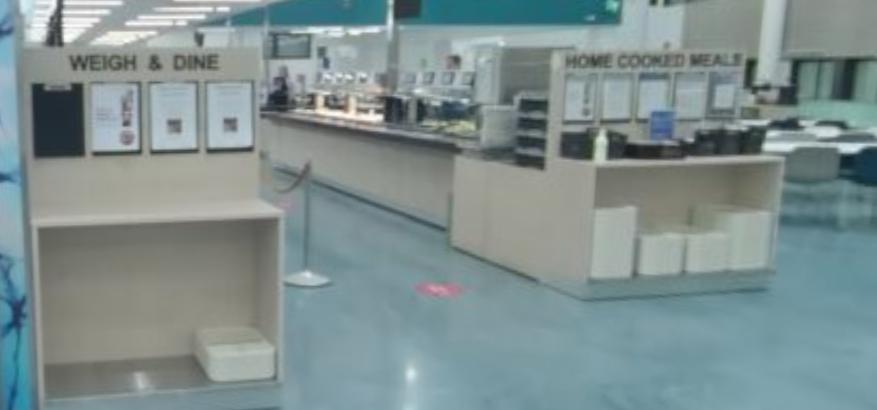
Lunch Line 🍽️
The lunch line produces per-lunch-tray datasets (nutrients, weight, etc).
Resources
Data
The Flavoria lunch lines are continuously producing automatic real-time data.
Sample
- Sample data 1
- TODO
Fields
- measurement weight (how much food was taken)
- menu details, nutrients, calories (see kitchen menu)
- identification code (for example QR code)
- tray sessions (how long dining took, what is on plate)
- cash register tray linkage (see cash register)
- TODO: list everything from data.utu.fi history
Database Diagram
The database consists of various tables that together form the fields in the previous listing
Data Quality
The public at large is using the research lunch line. This means the overall data quality cannot be guaranteed. Therefore not all use cases are possible. We have a document and internal knowledge on lessons learned, feel free to contact us to design a new idea!
Intervention studies can be picked from the mass data via unique identifiers either via QR codes given to the recruited customers, via MyFlavoria or via digitally marking specific trays before handing them out to the customers.
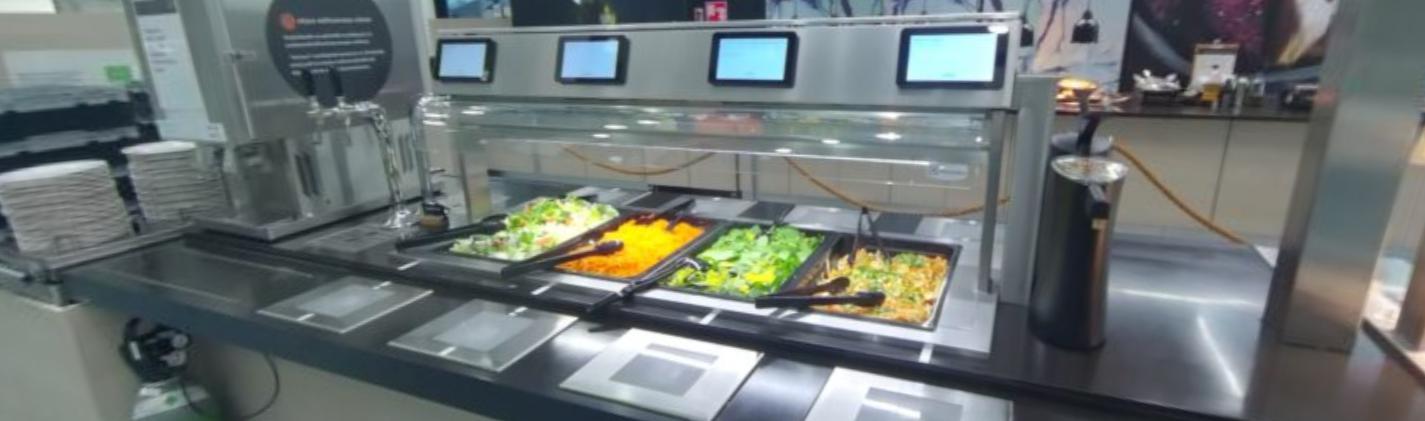
Infoscreen
The lunch line area contains infoscreens for previewing tray data similar to MyFlavoria by placing the tray down on the read. It can be modified for presenting various aspects of the meal composition as needed.
Compared to MyFlavoria, at the moment waste data is not shown as the tray is generally already discarded at that point.
TODO: infoscreen photo
Real-time data
Individual scales can be remotely monitored in real time for debugging or artistical purposes. Flavoria retains full code access to all parts of the lunch line infrastructure and in theory anything can be modified to accommodate novel research ideas.